Réduire la marche au ralenti dans les flottes municipales grâce aux cartes thermiques et à l'analyse des points chauds
Contexte
UAUne municipalité de taille moyenne gérait une flotte diversifiée prenant en charge les travaux publics, les inspections et les services urbains quotidiens. Face à l'augmentation des coûts du carburant et à des engagements environnementaux fermes, le service de la flotte a commencé à examiner l'efficacité opérationnelle des véhicules.
Bien que les performances du service restent élevées, la direction soupçonnait que des inefficacités cachées, en particulier une marche au ralenti excessive, augmentaient la consommation de carburant et les émissions sans apporter de valeur opérationnelle.
Problème
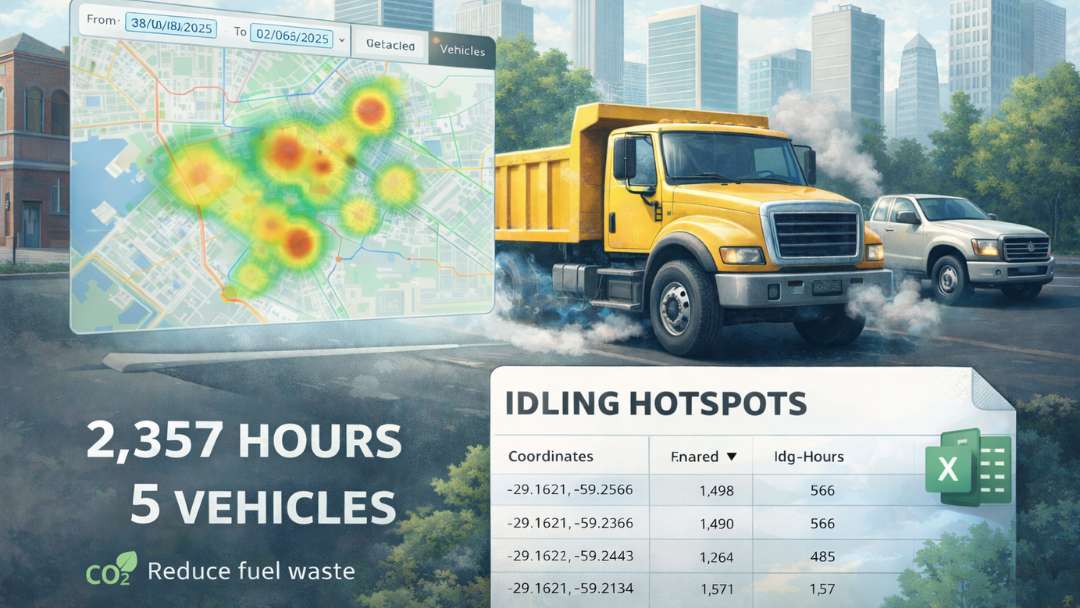
Après avoir analysé un sous-ensemble de seulement cinq véhicules, la municipalité a découvert un total de 2 357 heures de moteur au ralenti en une seule année. Cela représentait des milliers de litres de consommation de carburant inutile et d'importantes émissions de CO₂ évitables.
Cependant, connaître le nombre total d'heures n'était pas suffisant. L'équipe de la flotte devait comprendre où la marche au ralenti se produisait le plus fréquemment et quelles zones opérationnelles étaient à l'origine du problème. Sans visibilité basée sur la localisation, les actions correctives resteraient génériques et inefficaces.
Visualisation avec carte thermique + exportations de points chauds classés
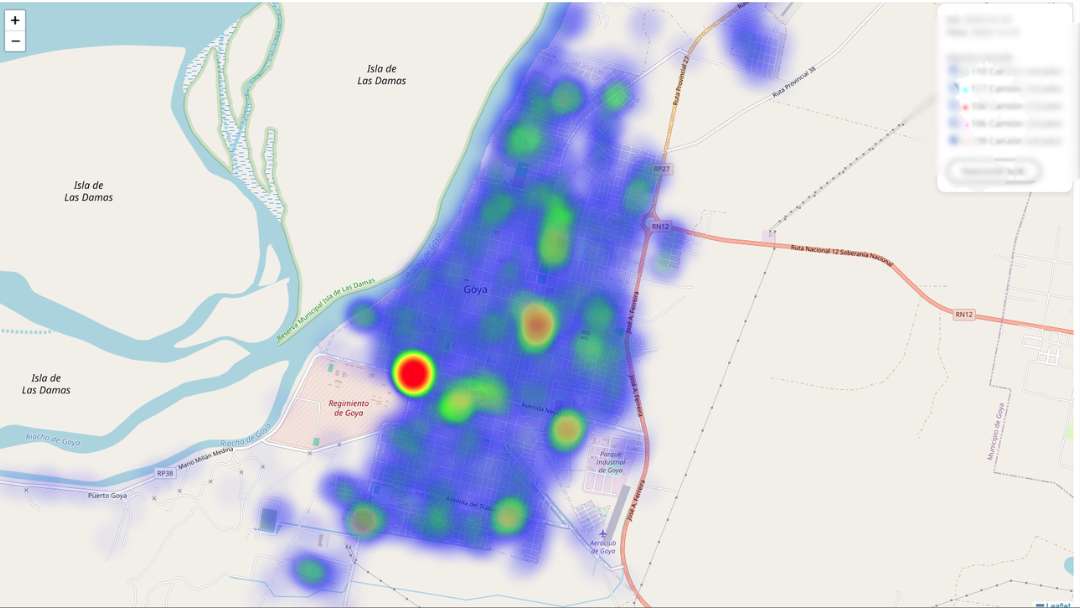
La municipalité a mis en place une détection de ralenti basée sur l'état du moteur allumé combiné à l'absence de mouvement. Les événements ont été géolocalisés et visualisés à l'aide d'une carte thermique HTML interactive, permettant aux gestionnaires d'identifier immédiatement les zones de concentration dans toute la ville.
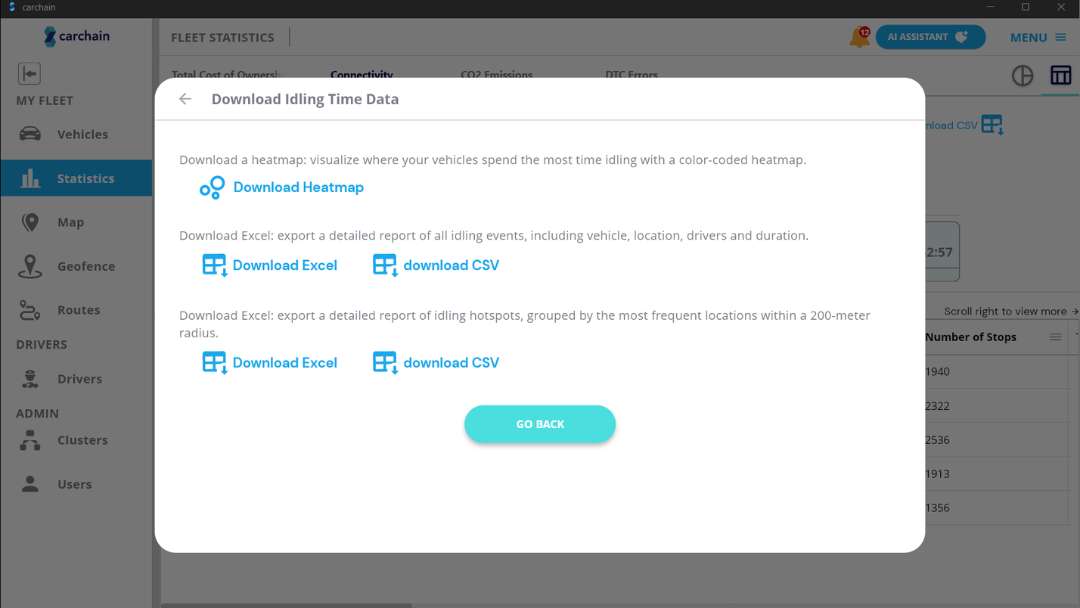
Pour passer de l'analyse à l'exécution, le système a également généré des exportations Excel et CSV répertoriant les coordonnées des points d'accès, le nombre d'événements d'inactivité par emplacement et le nombre total d'heures d'inactivité cumulées. Cela a permis à l’équipe de la flotte de classer objectivement les zones les moins performantes.
Les responsables ont filtré les résultats par véhicule et par plage horaire, identifiant les goulots d'étranglement récurrents à proximité des entrepôts, des zones de transit et des points d'exploitation à fort trafic. Les interventions ont ensuite été appliquées spécifiquement à ces zones.
- Carte thermique HTML interactive pour détecter les points chauds d'inactivité par emplacement
- Exporter vers Excel/CSV avec les coordonnées représentatives des points critiques
- Classement par nombre d'événements et nombre total d'heures d'inactivité accumulées
- Filtrer par véhicule et par date pour comparer les performances et valider les améliorations
En se concentrant sur des mesures correctives basées sur la localisation plutôt que sur de simples messages généraux destinés aux conducteurs, la municipalité a obtenu des réductions mesurables du temps d'inactivité sans perturber les services quotidiens.
Carte thermique interactive au ralenti
Des événements inactifs à l’intervention opérationnelle
L’état du moteur et les données GPS détectent les événements de ralenti. Les événements sont regroupés géographiquement à des points critiques. La carte thermique fournit un aperçu visuel instantané, tandis que les exportations Excel fournissent des coordonnées catégorisées avec le nombre d'événements et le nombre total d'heures pour une planification d'action structurée.
Impact mesuré
En transformant 2 357 heures de marche au ralenti cachée en informations exploitables sur les points d'accès, la municipalité a réalisé :
Réduction du gaspillage de carburant
Des interventions ciblées aux points critiques ont considérablement réduit la consommation de carburant inutile sans diminuer la couverture des services.
Réduction des émissions
La réduction du temps de fonctionnement excessif des moteurs a directement soutenu les objectifs municipaux de développement durable et amélioré les rapports environnementaux.
Visibilité opérationnelle améliorée
Les analyses basées sur la localisation ont fourni des données objectives pour les discussions et la responsabilisation des services.
Prolongation de la durée de vie des actifs
Réduction des heures d'utilisation du moteur, diminution de l'usure, contribuant ainsi à réduire la pression de maintenance et à prolonger la durée de vie du véhicule.
Ce qui a commencé comme un manque de visibilité a évolué vers un programme structuré de réduction du ralenti piloté par la chaleur, des données de points chauds classifiées et mesurables. tracking.
Petit sous-ensemble, grand aperçu
La découverte de 2 357 heures de marche au ralenti dans seulement cinq véhicules a démontré à quelle vitesse les coûts peuvent s'accumuler sans être détectés. Lorsqu'il est appliqué à l'ensemble d'un parc municipal, l'impact financier et environnemental devient considérable.
- Identifiez les principaux emplacements de points chauds par nombre total d'heures d'inactivité
- Donner la priorité à la refonte opérationnelle dans les domaines à fort impact
- Suivre les tendances d’amélioration mois par mois
- Aligner la réduction des coûts avec les objectifs de développement durable
Grâce aux cartes thermiques interactives et aux exportations structurées de points chauds dans Excel, les municipalités peuvent transformer la réduction de la marche au ralenti en un programme d'efficacité reproductible et basé sur des données.
Découvrez les points chauds de marche au ralenti de votre flotte
Découvrez combien d'heures de marche au ralenti évitables sont cachées dans votre flotte et où pour agir en premier.